Last time, I had set up my UPS monitoring software on my CentOS logging server. But I wanted more: what good is having a UPS if I can’t monitor things like voltage, battery charge, and load on an ongoing basis? Of course, the answer to this is to log to Splunk, which is what I ended up doing.
To do the logging, I used UPSLOG, which as you may be able to tell from the name, is a logger of UPS data. It took a few steps to get it set up properly, though, for long-term logging.
First, I created a new user to run upslog as, since I didn’t want it running as root for security reasons. That allows me to run upslog with the –u option to setuid to the new user. The log file itself is located at /var/log/ups.log. In order for Splunk to read it, I ran chmod of the log file to set the group to the splunk group, granting Splunk read access. So far, so good.
Eventually, the log is going to get huge, and so I want to rotate it properly. To do this, I created a new file in /etc/logrotate.d in order to manage the log rotation. Never having created a logrotate configuration file before, I went with this:
/var/log/ups.log {
weekly
rotate 14
compress
delaycompress
missingok
notifempty
create 644 upslog splunk
}
Will it work? We’ll see! The important things are to create the new log with owner and group of upslog and splunk respectively. If that works, we should be in good shape.
Finally, I wanted to create a init.d script for starting and stopping the service on boot and shutdown automatically. UPSLOG didn’t have an init script for some reason, so I copied the ups script and changed it accordingly:
#! /bin/bash
#
# upslog: Starts the UPS logging service
#
# chkconfig: – 26 74
# description: Starts the UPS logging service to log UPS statistics to /var/log/ups.log
# processname: upslog
#
### BEGIN INIT INFO
# Provides: upslog
# Required-Start: $syslog $network $named
# Required-Stop: $local_fs
# Default-Stop: 0 1 6
# Short-Description: Starts the UPS logging service
# Description: Stars the UPS logging service to log UPS statistics to /var/log/ups.log
### END INIT INFO
# Source function library.
if [ -f /etc/init.d/functions ]; then
. /etc/init.d/functions
elif [ -f /etc/rc.d/init.d/functions ]; then
. /etc/rc.d/init.d/functions
else
exit 0
fi
pidfile=/var/run/nut/upslog.pid
bin=/usr/bin/upslog
start() {
printf “Starting upslog…\n”
upslog -s apc@localhost -l /var/log/ups.log -u upslog
sleep 1
if [ -f $pidfile ]; then
printf “OK\n”
else
printf “Fail\n”
fi
}
stop() {
printf “Stopping upslog…”
if [ -f $pidfile ]; then
pid=`cat $pidfile`
kill $pid
printf “upslog stopped\n”
rm -f $pidfile
else
printf “pidfile not found\n”
fi
}
restart() {
stop
start
}
# See how we are called.
case “$1” in
start)
start ;;
stop)
stop ;;
restart)
restart ;;
status)
if [ “$SERVER” = “yes” ]; then
status upsd
fi
status upsmon
;;
*)
echo $”Usage: $0 {start|stop|restart|status}”
RETVAL=3
esac
exit $RETVAL
Will this work? Well, I can stop and start it well enough, and with a UPS hopefully I won’t need to power this down anytime soon. After saving this, and a chkconfig upslog on later, it said it would run on boot, so that looks good enough.
With all of that set up, getting the data into Splunk was a simple as setting up a new file data source. I created a new index called “ups” to hold the data, and soon I was getting events every 30 seconds:
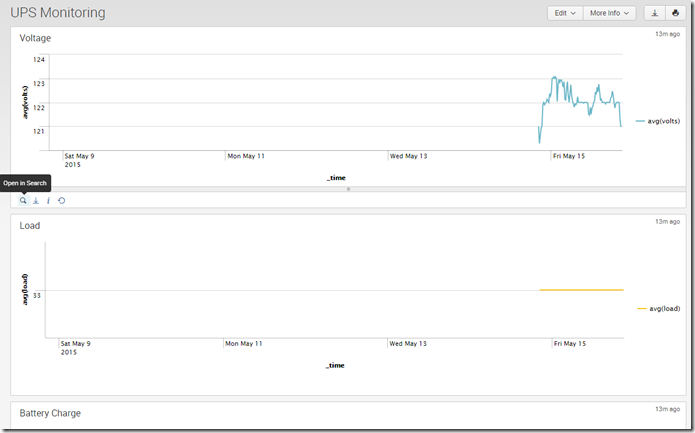
In order to get the volts, battery charge, and load, I used Splunk’s field extraction tool. With those fields extracted, my dashboards pretty much made themselves:
That, in a nutshell, is how easy it is to get UPS data into Splunk!


