When I finished part 4, I had a zone-based firewall set up with rules for traffic between each zone. Since I started with a locked-down configuration, how did I know what was getting blocked, especially those services that may run in the background without any user intervention? I solved this, and many other problems, by using Splunk to analyze my firewall rules and figure out what was getting blocked.
Splunk, for those who don’t know about it, is a log aggregator/data analyzer that is based on a map-reduce architecture to quickly chomp through huge data sets. Huge data sets like, for example, firewall logs! Setting up Splunk to analyze those firewall rules isn’t hard at all. First, of course, you need to install Splunk, which comes in both Windows and Unix versions. Then, set up Splunk to receive syslog on port 514 (or use your own syslog receiver and just have Splunk read the logs directly). Since I set this up on Windows, I did the former.
On the EdgeOS side, you can use either the GUI (in the System tab at the bottom) or the CLI (by configuring the syslog node) to point it at the host that Splunk is on. By default, EdgeOS limits syslog messages to errors only, and the only way to change this is via the CLI. Since we want informational logs as well, we’ll have to set that up via the CLI, which is easy to do; just change the level from notice to info. With that in place, Splunk will start receiving logs from your router.
What does a typical event look like? Here’s an accept event for a firewall rule:
Jul 31 21:29:38 192.168.1.254 Jul 31 21:29:47 erl1 kernel: [WLAN-WAN-200-A]IN=eth1 OUT=eth2 MAC=24:a4:3c:05:28:1e:c8:60:00:d4:b5:d9:08:00 SRC=192.168.1.11 DST=74.125.192.95 LEN=52 TOS=0x00 PREC=0x00 TTL=127 ID=26199 DF PROTO=TCP SPT=65239 DPT=443 WINDOW=8192 RES=0x00 SYN URGP=0
There’s a lot here, but it’s pretty easy to parse: The time, source, hostname, firewall rule (in this case rule 200 for WLAN to WAN traffic, which allows HTTP/S traffic), in and out interfaces, MAC address, source and destination IPs, source and destination ports, protocol, TTL, and various flags. This event appears to be a connection to Google over SSL, for example.
You can use this information directly to start hunting for firewall drops, it can be tricky. What would be nice is to get a view of just firewall drops, for example. Luckily, EdgeOS and Splunk make this easy. All drops are going to end in “-D]” and all accepts are going to end in “-A]”, so it is possible to extract those fields with a simple regex, which Splunk can build interactively. A few clicks and there it is, a new field with exactly the data you want.
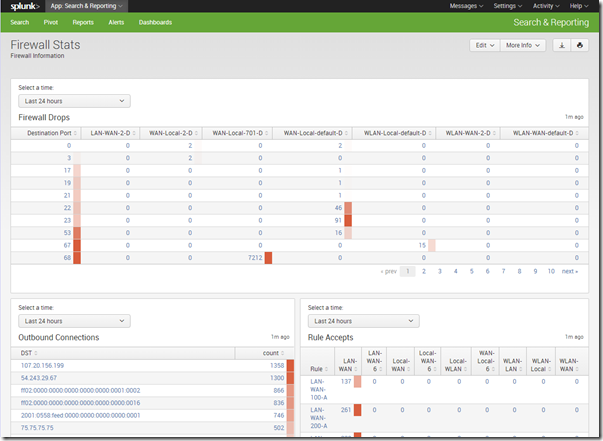
It gets better, though. Splunk has dashboards that are really easy to set up, plus pivot reports. Put those two together, and this is the kind of overview you can get:
I have a report showing firewall drops (by rule and destination port), outbound connections, and accepts (by interface pair and rule, so I can ensure that my rule ordering is most efficient). All of these default to last 24 hours, but I have time pickers to allow me to change that to any time period I want (I had to fiddle with the XML source but eventually figured it out). Easy!
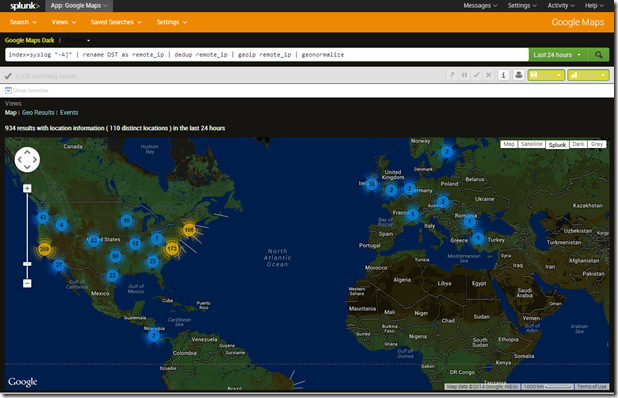
But wait, there’s more! Splunk apps can do neat things like geomapping IP addresses. How about a map of where those connections in the past 24 hours are going? Yes, Splunk can do this with the help of a Google Maps Splunk app:
Using Splunk, I have a ton of data at my fingertips. Too much, sometimes, in fact. Looking at firewall logs and trying to find an explanation for every little weird event is a task that could easily turn into a full-time job, so it’s important to know when to just leave it alone. Splunk can correlate events, set up alerts, and do other neat stuff, so if you really care about strange events, you can set up searches to let you know when they happen.
Pretty much everything is done with my EdgeRouter setup at this point, save for one final task, one of the primary drivers of this adventure in the first place: IPv6. It’s fitting that Part 6 will be setting up IPv6, and that’s the next installment.


