Many years ago, I wrote a blog post about monitoring my UPS with Splunk. Since then, I’ve moved away from Splunk to the Elastic stack. Fortunately, moving that monitoring over was pretty much a breeze.
The information is still coming from upslog, which is bundled in with nut. FIrst, I configured nut to define the UPS and the connectivity, in this case a USB connection. Then, I had to modify the upslog.service file to get it to start and monitor the correct UPS device, then output it to /var/log/ups.log. Honestly, that was the hardest part of the configuration. From here, it was a breeze.
Once upslog was outputting data to the log file, I simply created a logstash config to read it:
input {
    file {
        path => "/var/log/ups.log"
        tags => [ "ups" ]
    }

}
Then, this grok filter parses out all the appropriate fields:
filter {
  ...
  else if "ups" in [tags] {
    grok {
      match => {
        message => [ "^%{DATA:rawdate} %{DATA:rawtime} %{INT:battery.charge} %{NUMBER:battery.volts:float} %{INT:battery.load} \[%{DATA:battery.status}\] %{GREEDYDATA}$" ]
      }
      add_tag => [ "ups_parsed" ]
    }
    mutate {
      copy => {
        "message" => "log.original"
      }
      rename => {
        "host" => "host.hostname"
        "path" => "file.name"
      }
    }
  }
}
This is directed into a datastream in Elastic:
output {
  ...
  else if "ups" in [tags] {
    elasticsearch {
      hosts => [ "192.168.2.12:9200" ]
      index => "logstash-ups"
      manage_template => false
      user => logstash_writer
      password => xxxxxxxxxxxxxxxx
      action => "create"
    }
  }
}
I’m a big fan of the Elastic Common Schema (ECS), and I’ve extended it where necessary, such as this mapping for the UPS battery fields:
{
"_meta": {
"version": "1.5.0"
},
"date_detection": false,
"dynamic_templates": [
{
"strings_as_keyword": {
"mapping": {
"ignore_above": 1024,
"type": "keyword"
},
"match_mapping_type": "string"
}
}
],
"properties": {
"@timestamp": {
"type": "date"
},
"battery": {
"type": "object",
"properties": {
"charge": {
"type": "integer"
},
"load": {
"type": "integer"
},
"status": {
"type": "keyword"
},
"volts": {
"type": "float"
}
}
}
}
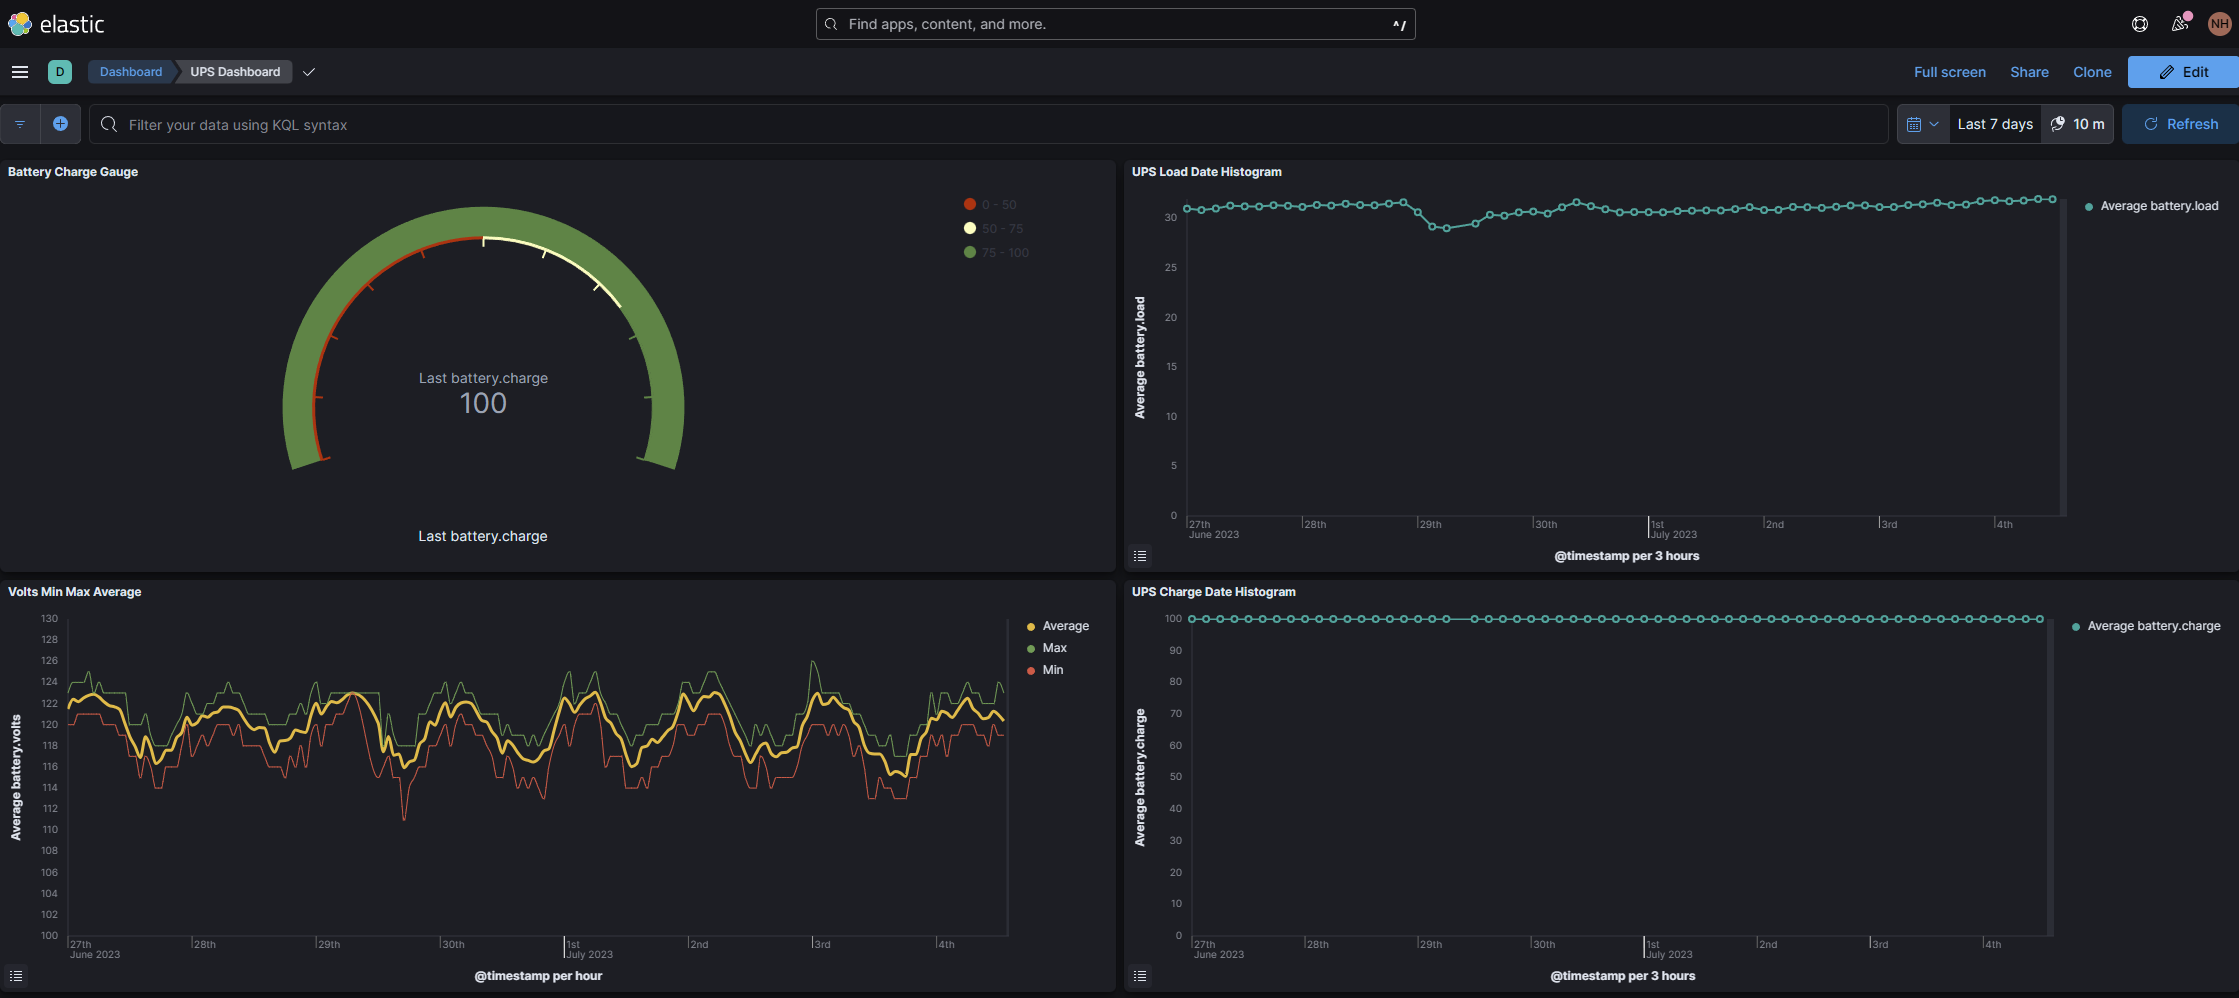
}Putting all of that together, I get parsed, well-formatted data that allows me to monitor my UPS on a custom dashboard: