
Recently I purchased a new computer case to replace the ancient giant one I bought in 2009. The various fans had stopped working, and I realized that I no longer had a large number of external drives like DVD drives and so forth, so when Newegg had that case on sale, I uncharacteristically made an impulse purchase.
After moving everything over and getting things up and running again, I decided that I wanted to monitor the cooling performance of my new case. I have long used Core Temp to show the temperature of my CPU in my system tray, but that only showed the current temp. I had no way of graphing that information over time. Since I use Elasticsearch as my logging platform, the obvious solution was to somehow get the data into Elasticsearch and show it on a Kibana dashboard. This is how I did it.
Step 1: Install Core Temp Remote Server
Core Temp has a number of plugins, and one of them is Core Temp Remote Server. It exposes data from Core Temp on a port, conveniently in JSON format. Installing and configuring this plugin was simple, and after it was running, Core Temp data was accessible on port 5200.
Step 2: Set up Logstash listener
I use Logstash to ingest various logs into Elasticsearch. To get this data into Elasticsearch, all I had to do was create a new input:
  tcp {
    host => "127.0.0.1"
    port => "5200"
    codec => "json"
    tags => [ "coretemp" ]
  }
as well as a new output:
  else if "coretemp" in [tags] {
    elasticsearch {
      hosts => [ "127.0.0.1:9200" ]
      index => "logstash-coretemp-%{+YYYY.MM.dd}"
      manage_template => false
      user => logstash_writer
      password => XXXXXXXXXXXXXXXXXXXXX
    }
  }
With that configuration, sending Core Temp data to port 5200 on the Logstash server would get it into Elasticsearch, and since it’s already in JSON format, no additional parsing would be necessary.
There was one last item though: both Core Temp and Logstash had listeners for data. That meant I had to create the connection to move the data over.
Step 3: Create the connection
My first thought about how to connect the two together was to use netcat on the Logstash machine, which is a Linux server. I would netcat to the Core Temp server, and pipe the output to another netcat instance to output it to Logstash:
nc 192.168.1.100 5200 | nc 127.0.0.1 5200And it worked! However, it was running in my terminal and thus I couldn’t do anything else, and it would cease running if I disconnected my SSH session. Using nohup, disown, or tmux could solve those problems, but the other problem was that it was brittle: if either Core Temp or Logstash weren’t available, it would die and I’d have to manually restart it. No good.
So I started Googling and found some potential solutions, which I ultimately combined to make it resilient: first, I’d drop netcat for socat, so as to be able to do it in a one-liner:
socat TCP4:192.168.1.100:5200 TCP4:127.0.0.1:5200 &socat basically works like the two netcat processes I had piped together, so that was simple. I still needed a way to monitor that socat was running and restart it if it wasn’t, and Google again pointed me to the answer: create a cron script to make sure it is running:
#!/bin/bash
case "$(pidof socat | wc -w)" in
0) socat TCP4:192.168.1.100:5200 TCP4:127.0.0.1:5200 &
   ;;
1) ;;
*) kill $(pidof socat | awk '{print $1}')
   ;;
esac
I saved the above script to a file and set up a cron job to run every 5 minutes. Now, if socat dies because Core Temp or Logstash are unavailable, once they are back socat will be sending data within five minutes. And that’s good enough for me.
With that done, all that was left was to create some dashboards:

With these dashboards, I can easily monitor temp, load, memory consumption, and other data as I see fit. Mission accomplished!
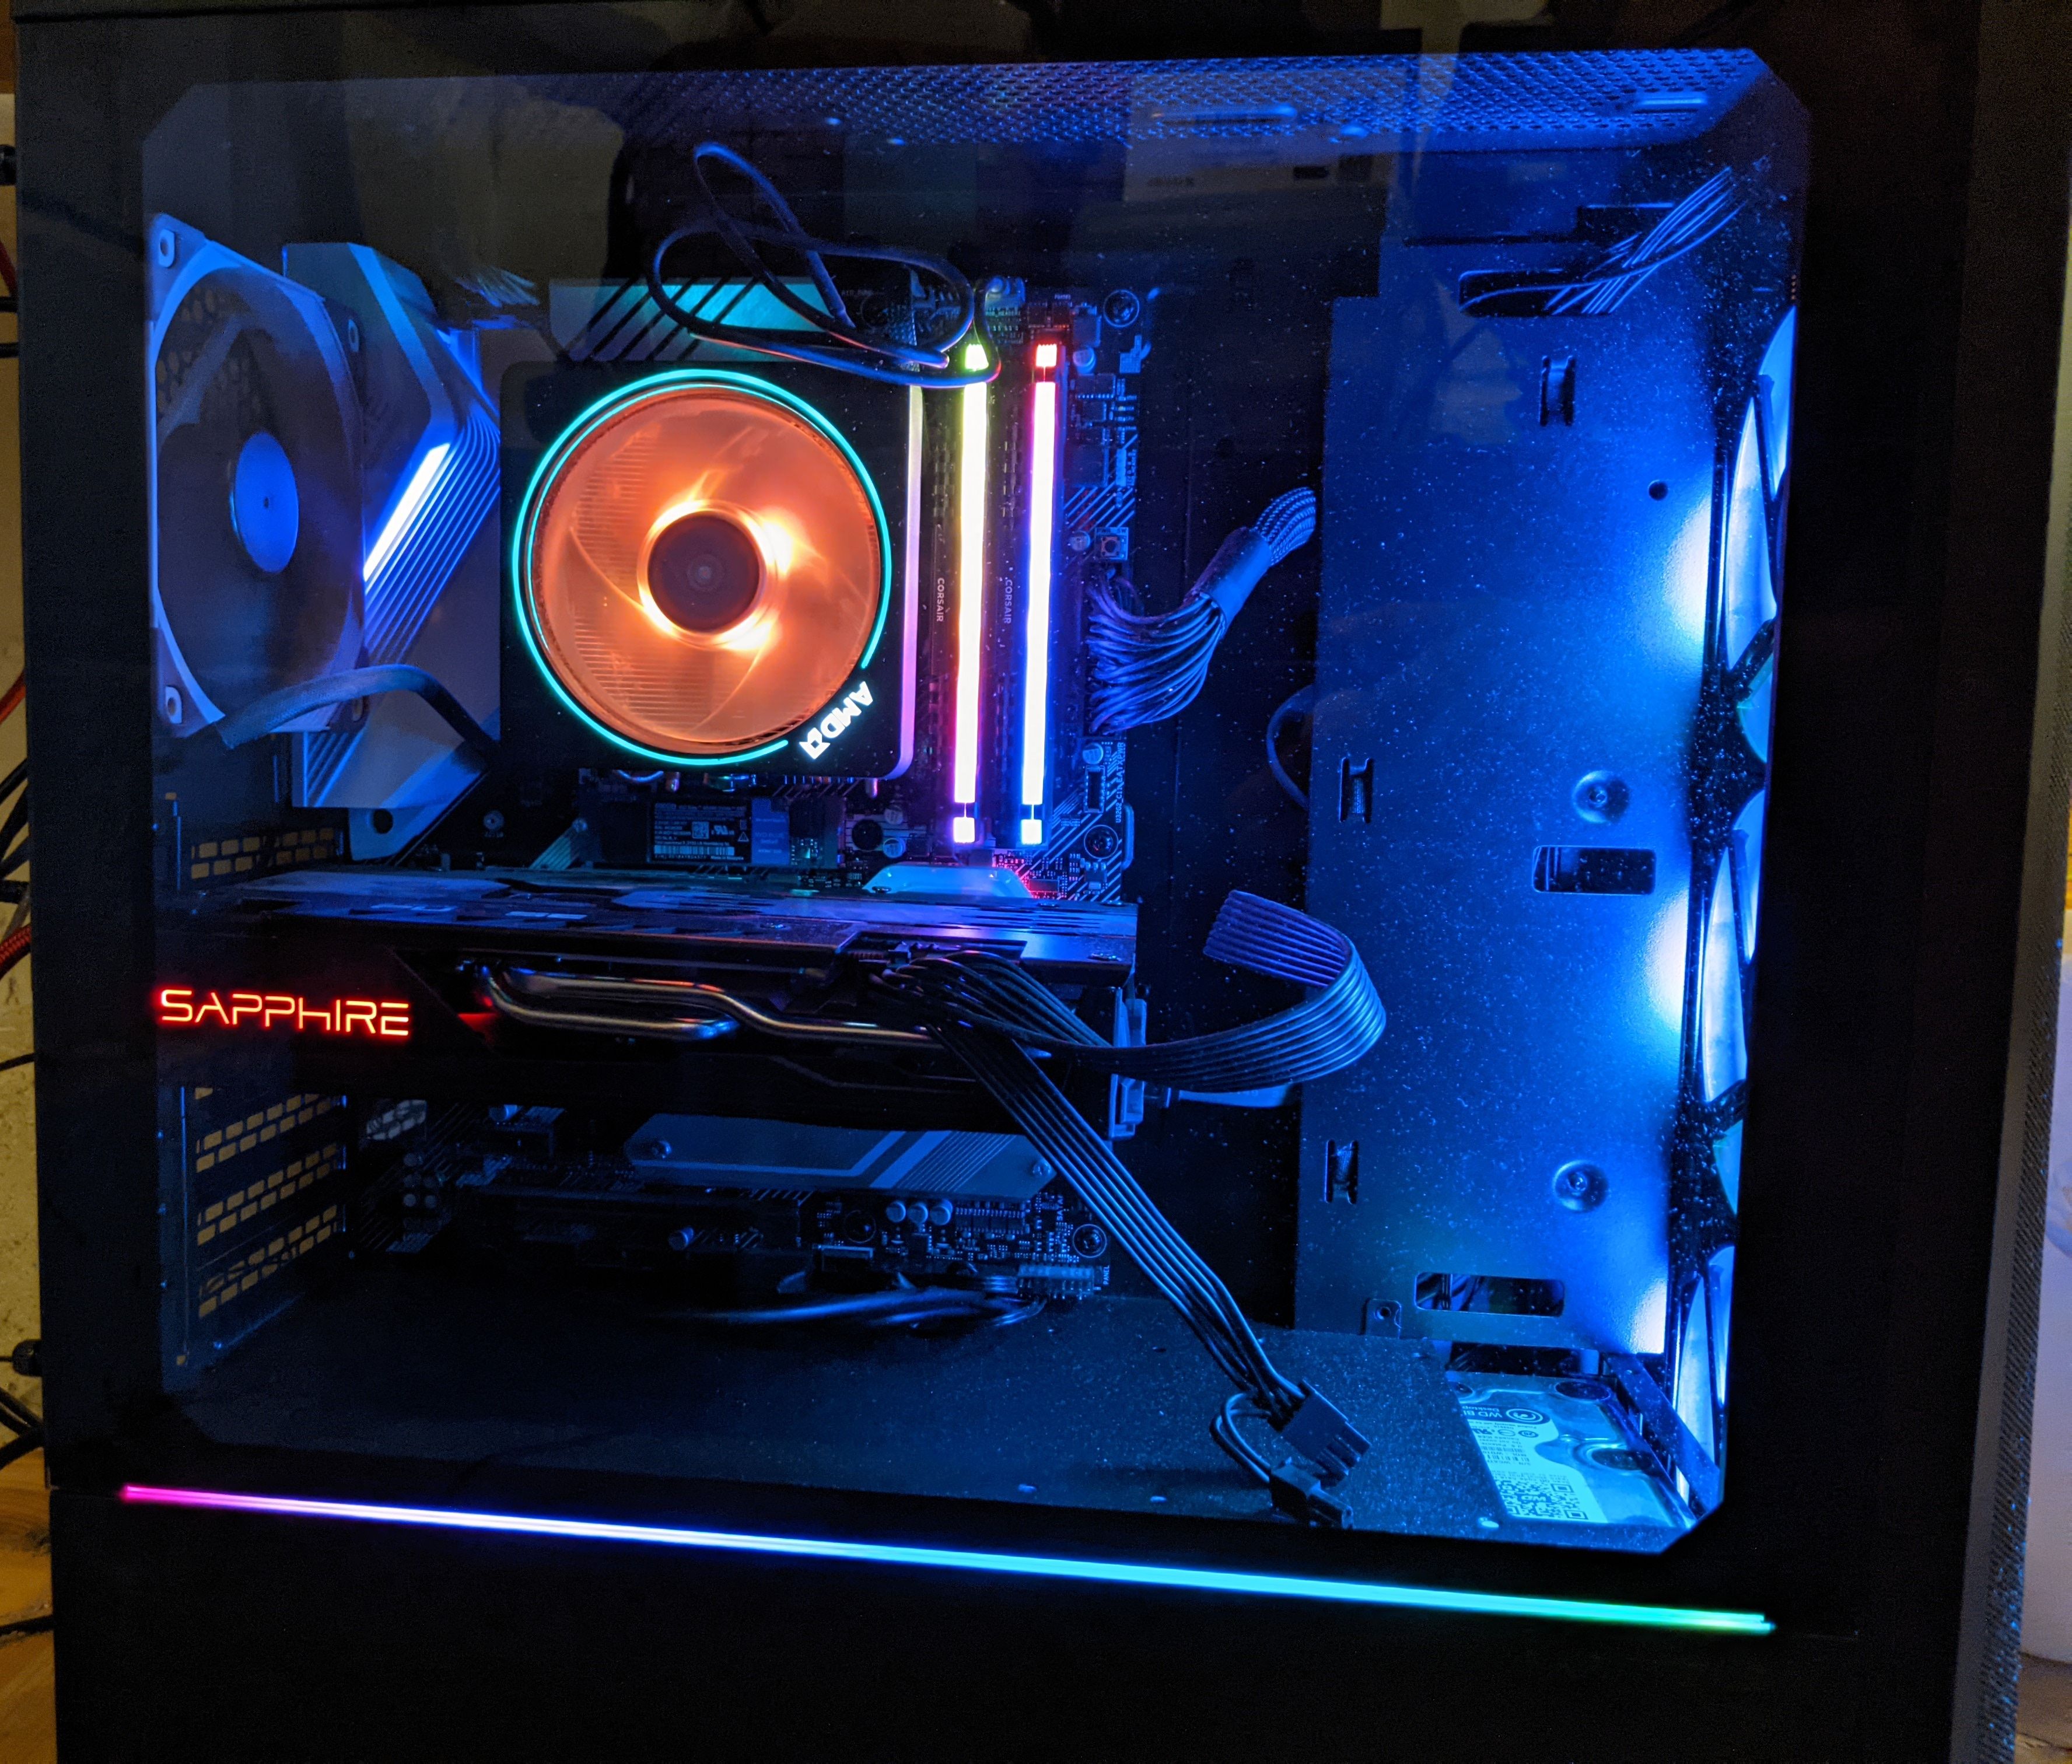
Bonus picture of new case:
1 comment