As part of my home network setup, I talked a bit about how I set up Splunk and used it for metrics on firewall performance. Splunk is an incredibly powerful tool and can be used for much, much more than that. This weekend I pretty easily set up a cool new dashboard to monitor brute-force attempts against my website using Splunk. Below is what I did.
What I was most interested in was monitoring brute force attempts against my main website (http://www.nathanhunstad.com), which is built on Joomla. Joomla records authentication errors in an errors.php file like so:
2014-07-22 11:26:50 INFO 176.102.38.74 Joomla FAILURE: Username and password do not match or you do not have an account yet.
As you can see, I have date, time, notification level (INFO), client IP, and the fact that the login was a failure. From here, it’s easy to have Splunk report on attacks.
The first step is to get the data into Splunk. I downloaded the file from my website and stuck it in a place where Splunk could find it. I configured a new file-based data source, pointed it at the file, set up a new sourcetype (php_error) and set each line as a separate event. I then set up a field extraction to grab the IP address, and I was done with manipulating the data.
Next, I set up a search to show brute force attempts. This was the search string:
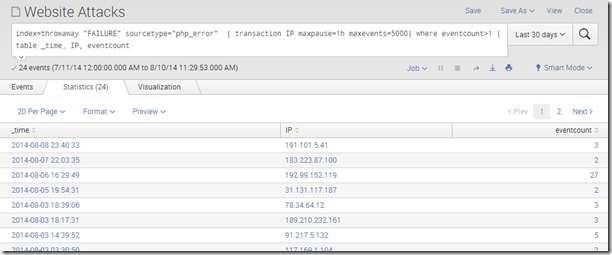
index=throwaway “FAILURE” sourcetype=”php_error” | transaction IP maxpause=1h maxevents=5000| where eventcount>1 | table _time, IP, eventcount
Step by step: I have this in my throwaway index for now since I am still playing with it. It is searching sourcetype php_error for FAILURE notices. It then groups transactions by IP address, with a maxpause of 1 hour: if the same IP address has multiple events within an hour of each other, I consider that to be part of the same brute force attempt, but any more than that is a separate event. The maximum number of events in any one transaction I override from the default 1,000 to 5,000. I then only include transactions with an eventcount great than 1: a single failed login from an IP is not a brute force attempt. Finally, my results are a table with the time of the event, the IP address, and the count of failed logins:
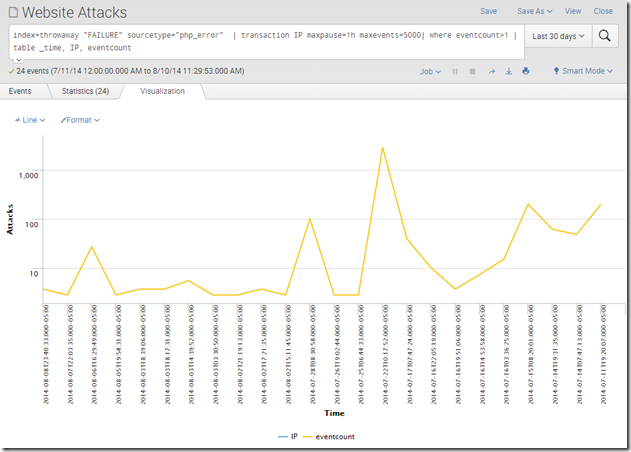
From there, it’s a simple step to show that in a graph. I have the y-axis set as a log scale to better show the differences:
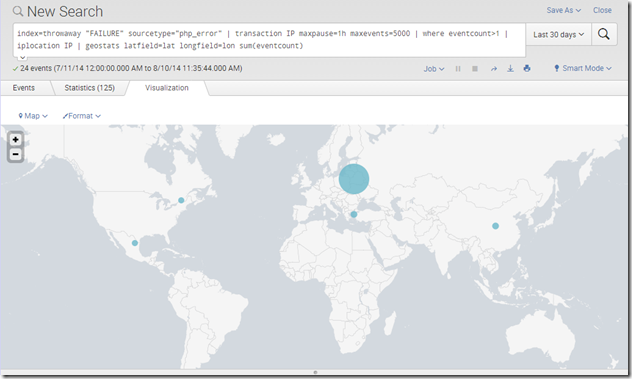
Mapping is almost as easy. To get stats that I can put on a map, I slightly tweaked the search string:
index=throwaway “FAILURE” sourcetype=”php_error” | transaction IP maxpause=1h maxevents=5000 | where eventcount>1 | iplocation IP | geostats latfield=lat longfield=lon sum(eventcount)
iplocation is the command for Splunk to translate IP addresses into lat/lon data, and then the geostats command creates geo-based statistics based on what we interested in: here the sum of events from particular locations. This is the result:
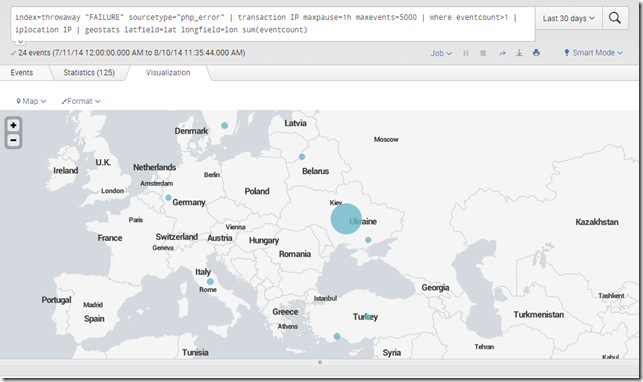
From there, I can zoom in to get more granular results:
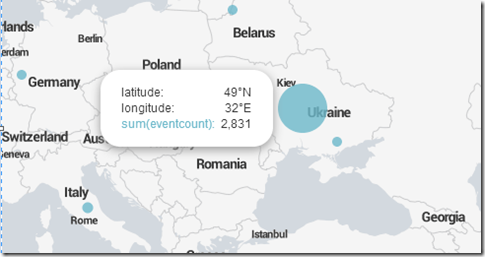
Hovering gets me stats I can drill down into:
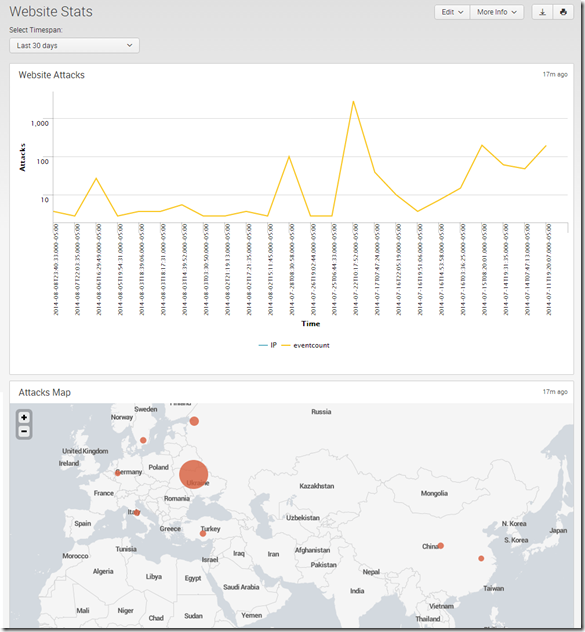
Finally, I put it all together on a dashboard with a timepicker I can use to customize the time period:
That’s it! It took a couple of hours of playing around and learning the syntax; from now on this is going to be easy.
The only problem I have with this setup is that it is static: I grabbed these files on time to figure out how to do it. Now I have to set up a script to grab the log files on a daily basis to pull them down from my website and get them into Splunk, but once that is up and running I will have updated stats on brute force attempts on a daily basis. Not bad for a morning’s work!

2 comments
Comments are closed.